import polars as pl
from pathlib import Path
data = pl.read_parquet(f"{Path('../../../')}/datasets/tsa.parquet")
data.sample(5)| Date | Numbers |
|---|---|
| date | i64 |
| 2022-07-25 | 2386005 |
| 2023-12-08 | 2431077 |
| 2020-04-02 | 160826 |
| 2023-04-19 | 2227164 |
| 2022-02-04 | 1583678 |
Creating a stunning table with TSA airport checking data
Joram Mutenge
June 13, 2024
This year, I decided to participate in the Posit Table Contest. Because I’m a fan of the great tables Python library I thought it would be great to enhance my mastery of this beautiful library by designing a table. I’ll use the Polars library for data munging and transformation.

The data was collected from the Transport Security Administration website, which has archived data on the number of airport passenger checkings done daily from 2019 to 2023. The data was then saved as a parquet file containing columns Date and Numbers.
Reading the original data and displaying five random records.
import polars as pl
from pathlib import Path
data = pl.read_parquet(f"{Path('../../../')}/datasets/tsa.parquet")
data.sample(5)| Date | Numbers |
|---|---|
| date | i64 |
| 2022-07-25 | 2386005 |
| 2023-12-08 | 2431077 |
| 2020-04-02 | 160826 |
| 2023-04-19 | 2227164 |
| 2022-02-04 | 1583678 |
Creating new columns to enable more data transformations.
df = (data
.with_columns(Year=pl.col('Date').dt.year(),
Month=pl.col('Date').dt.month(),
Day=pl.col('Date').dt.day())
.with_columns(pl.when(pl.col('Month').eq(11) & pl.col('Day').eq(28))
.then(pl.lit('Thanksgiving'))
.when(pl.col('Month').eq(12) & pl.col('Day').eq(25))
.then(pl.lit('Christmas'))
.when(pl.col('Month').eq(7) & pl.col('Day').eq(4))
.then(pl.lit('July 4th'))
.when(pl.col('Month').eq(5) & pl.col('Day').eq(27))
.then(pl.lit('Memorial Day'))
.otherwise(None)
.alias('Holiday')
)
)
df.head()| Date | Numbers | Year | Month | Day | Holiday |
|---|---|---|---|---|---|
| date | i64 | i32 | i8 | i8 | str |
| 2019-01-01 | 2201765 | 2019 | 1 | 1 | null |
| 2019-01-02 | 2424225 | 2019 | 1 | 2 | null |
| 2019-01-03 | 2279384 | 2019 | 1 | 3 | null |
| 2019-01-04 | 2230078 | 2019 | 1 | 4 | null |
| 2019-01-05 | 2049460 | 2019 | 1 | 5 | null |
In the code below, I’m creating a single-row dataframe, showing the highest number of checkings for each year. I’m leveraging looping to avoid repeating myself five times. The five dataframes are combined into a single dataframe called highest_df.
# Create high dataframe
high_dfs = []
for year in df['Year'].unique().to_list():
high_df = pl.DataFrame({'Year':year,
'Date':(df.filter(pl.col('Year') == year).filter(pl.col('Numbers') == pl.col('Numbers').max())['Date']),
'Numbers':df.filter(pl.col('Year') == year)['Numbers'].max(),
'Holiday':'Highest Record',
})
high_dfs.append(high_df)
highest_df = pl.concat(high_dfs).with_columns(pl.col('Numbers').cast(pl.Int64))
highest_df.sample(3)| Year | Date | Numbers | Holiday |
|---|---|---|---|
| i32 | date | i64 | str |
| 2023 | 2023-11-26 | 2908785 | "Highest Record" |
| 2021 | 2021-11-28 | 2458325 | "Highest Record" |
| 2019 | 2019-12-01 | 2882915 | "Highest Record" |
To create a dataframe with the lowest number of checkings, I repeat the above process, replacing max() with min().
# Create low dataframe
low_dfs = []
for year in df['Year'].unique().to_list():
low_df = pl.DataFrame({'Year':year,
'Date':(df.filter(pl.col('Year') == year).filter(pl.col('Numbers') == pl.col('Numbers').min())['Date']),
'Numbers':df.filter(pl.col('Year') == year)['Numbers'].min(),
'Holiday':'Lowest Record',
})
low_dfs.append(low_df)
lowest_df = pl.concat(low_dfs).with_columns(pl.col('Numbers').cast(pl.Int64))
lowest_df.sample(3)| Year | Date | Numbers | Holiday |
|---|---|---|---|
| i32 | date | i64 | str |
| 2022 | 2022-01-25 | 1063856 | "Lowest Record" |
| 2019 | 2019-11-28 | 1591158 | "Lowest Record" |
| 2021 | 2021-01-26 | 508467 | "Lowest Record" |
In this code, I create another dataframe with the total number of checkings for each year by using sum().
# Create total dataframe
tot_dfs = []
for year in df['Year'].unique().to_list():
tot_df = pl.DataFrame({'Year':year,
'Date':None,
'Numbers':df.filter(pl.col('Year') == year)['Numbers'].sum(),
'Holiday':'Annual Checkings',
'Distribution':None
})
tot_dfs.append(tot_df)
total_df = pl.concat(tot_dfs).with_columns(pl.col('Year').cast(pl.Int32))
total_df.sample(3)| Year | Date | Numbers | Holiday | Distribution |
|---|---|---|---|---|
| i32 | null | i64 | str | null |
| 2019 | null | 848102043 | "Annual Checkings" | null |
| 2023 | null | 858548196 | "Annual Checkings" | null |
| 2020 | null | 339774756 | "Annual Checkings" | null |
This code creates a dataframe where the value in Holiday is not null.
# Create holiday dataframe
hol_dfs = []
for year in df['Year'].unique().to_list():
hol_df = (df
.filter(pl.col('Year') == year)
.filter(pl.col('Holiday').is_not_null())
.select('Year','Date','Numbers','Holiday')
)
hol_dfs.append(hol_df)
holiday_dfs = pl.concat(hol_dfs)
holiday_dfs.sample(3)| Year | Date | Numbers | Holiday |
|---|---|---|---|
| i32 | date | i64 | str |
| 2022 | 2022-07-04 | 2086854 | "July 4th" |
| 2020 | 2020-12-25 | 683838 | "Christmas" |
| 2023 | 2023-05-27 | 2206475 | "Memorial Day" |
The dataframe below creates a list of the average number of monthly checkings for each year. The created lists are row values for a column called Distribution.
# Create distribution dataframe
dist_dfs = []
for year in df['Year'].unique().to_list():
dist_df = (df
.filter(pl.col('Year') == year)
.group_by('Month')
.agg(pl.mean('Numbers'), pl.first('Year'))
.sort('Month')
.with_columns(Distribution=pl.col('Numbers').implode())
.select('Year','Distribution').head(1)
)
dist_dfs.append(dist_df)
distribution_df = pl.concat(dist_dfs)
distribution_df.sample(3)| Year | Distribution |
|---|---|
| i32 | list[f64] |
| 2020 | [2.0946e6, 2.1359e6, … 896292.225806] |
| 2019 | [1.9902e6, 2.0906e6, … 2.3577e6] |
| 2022 | [1.4902e6, 1.7396e6, … 2.1333e6] |
Finally, I’m combining all the created dataframes into a single dataframe called TSA and adding another column Icon containing the names of the icons like the turkey and Christmas tree used in the stunning table. TSA is the dataframe used to make the stunning table.
# Combine all dataframes and add Icon column.
TSA = (pl.concat([holiday_dfs, highest_df, lowest_df])
.join(distribution_df, on='Year', how='inner')
.vstack(total_df)
.with_columns(pl.when(pl.col('Holiday') == "Thanksgiving")
.then(pl.col('Distribution'))
.otherwise(None)
.alias('Distribution')
)
.with_columns(pl.when(pl.col('Holiday') == "Memorial Day")
.then(pl.lit('memorial.svg'))
.when(pl.col('Holiday') == "July 4th")
.then(pl.lit('flag.svg'))
.when(pl.col('Holiday') == "Thanksgiving")
.then(pl.lit('turkey.svg'))
.when(pl.col('Holiday') == "Christmas")
.then(pl.lit('christmas.svg'))
.when(pl.col('Holiday') == "Highest Record")
.then(pl.lit('high.svg'))
.when(pl.col('Holiday') == "Lowest Record")
.then(pl.lit('low.svg'))
.otherwise(pl.lit('calendar.svg'))
.alias('Icon')
)
.select('Icon', 'Holiday', 'Year', 'Date', 'Numbers', 'Distribution')
.sort('Year')
)
TSA.sample(3)| Icon | Holiday | Year | Date | Numbers | Distribution |
|---|---|---|---|---|---|
| str | str | i32 | date | i64 | list[f64] |
| "flag.svg" | "July 4th" | 2022 | 2022-07-04 | 2086854 | null |
| "high.svg" | "Highest Record" | 2020 | 2020-02-14 | 2507588 | null |
| "low.svg" | "Lowest Record" | 2021 | 2021-01-26 | 508467 | null |
After transforming the data into the desired format, I am now creating the table. The code below generates the table, which will be my final submission.
from great_tables import GT, html, loc, style, md, nanoplot_options
display(
GT(TSA, rowname_col="Icon", groupname_col="Year")
.tab_stubhead(label=html('<b style="font-family: Inter, sans-serif; font-weight: 500;">Year</b>'))
.tab_header(title=html('''
<link href="https://fonts.googleapis.com/css2?family=Inter:wght@400;900&display=swap" rel="stylesheet">
<h2 style="text-align:center; display: flex; align-items: center; justify-content: center; font-family: Inter, sans-serif; font-weight: 500; color: #014eac;">
<img src="assets/plane3.svg" alt="Plane Icon" style="margin-right: 34px; height: 54px;">
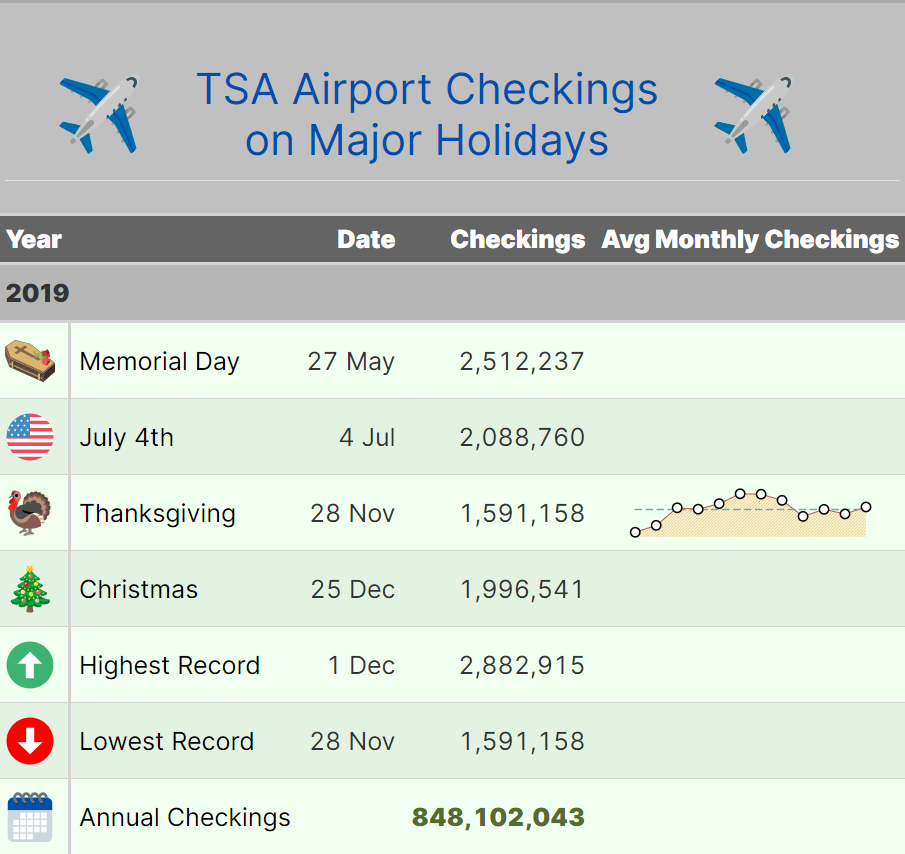
TSA Airport Checkings<br>on Major Holidays
<img src="assets/plane3.svg" alt="Plane Icon" style="margin-left: 34px; height: 54px;">
</h2>
'''))
.tab_options(container_width="100%",
table_background_color='#F0FFF0',
heading_background_color="#C0C0C0",
column_labels_background_color="#696969",
row_group_font_weight='bold',
row_group_background_color='#C0C0C0',
source_notes_font_size='12px',
row_group_padding='8px',
table_font_names="Open Sans")
.cols_label(Date=html('<b style="font-family: Inter, sans-serif; font-weight: 500;">Date</b>'),
Numbers=html('<b style="font-family: Inter, sans-serif; font-weight: 500;">Checkings</b>'),
Distribution=html('<b style="font-family: Inter, sans-serif; font-weight: 500;">Avg Monthly Checkings</b>'),
Holiday='')
.fmt_number(columns='Numbers', decimals=0)
.cols_width(cases={'Date':'120px'})
.fmt_date(columns="Date", date_style="day_m")
.tab_style(style=style.text(color='#556B2F', weight='bold'),
locations=loc.body(rows=pl.col("Holiday") == "Annual Checkings"))
.tab_style(style=style.text(color='black', weight='normal'),
locations=loc.body(columns="Holiday"))
.sub_missing(missing_text='')
.fmt_nanoplot(columns="Distribution", reference_line="mean",
options=nanoplot_options(data_point_radius=12,
data_point_stroke_color="black",
data_point_stroke_width=4,
data_point_fill_color="white",
data_line_type="straight",
data_line_stroke_color="brown",
data_line_stroke_width=2,
data_area_fill_color="#FF8C00",
vertical_guide_stroke_color="green"))
.fmt_image("Icon", path="assets")
.tab_source_note(source_note=md("**Source:** [TSA Passenger Volumes](https://www.tsa.gov/travel/passenger-volumes)<br/>**Designer:** Joram Mutenge<br/>*www.jorammutenge.com*"))
)/Users/mute/Desktop/ne/summerfall/lib/python3.13/site-packages/great_tables/_render_checks.py:37: RenderWarning:
Rendering table with .col_widths() in Quarto may result in unexpected behavior. This is because Quarto performs custom table processing. Either use all percentage widths, or set .tab_options(quarto_disable_processing=True) to disable Quarto table processing.
|
||||
|---|---|---|---|---|
| Year | Date | Checkings | Avg Monthly Checkings | |
| 2019 | ||||
| Memorial Day | 27 May | 2,512,237 | ||
| July 4th | 4 Jul | 2,088,760 | ||
| Thanksgiving | 28 Nov | 1,591,158 | ||
| Christmas | 25 Dec | 1,996,541 | ||
| Highest Record | 1 Dec | 2,882,915 | ||
| Lowest Record | 28 Nov | 1,591,158 | ||
| Annual Checkings | 848,102,043 | |||
| 2020 | ||||
| Memorial Day | 27 May | 283,387 | ||
| July 4th | 4 Jul | 495,309 | ||
| Thanksgiving | 28 Nov | 966,412 | ||
| Christmas | 25 Dec | 683,838 | ||
| Highest Record | 14 Feb | 2,507,588 | ||
| Lowest Record | 14 Apr | 113,147 | ||
| Annual Checkings | 339,774,756 | |||
| 2021 | ||||
| Memorial Day | 27 May | 1,867,067 | ||
| July 4th | 4 Jul | 1,697,422 | ||
| Thanksgiving | 28 Nov | 2,458,325 | ||
| Christmas | 25 Dec | 1,535,935 | ||
| Highest Record | 28 Nov | 2,458,325 | ||
| Lowest Record | 26 Jan | 508,467 | ||
| Annual Checkings | 585,250,987 | |||
| 2022 | ||||
| Memorial Day | 27 May | 2,397,928 | ||
| July 4th | 4 Jul | 2,086,854 | ||
| Thanksgiving | 28 Nov | 2,389,672 | ||
| Christmas | 25 Dec | 1,800,463 | ||
| Highest Record | 27 Nov | 2,639,616 | ||
| Lowest Record | 25 Jan | 1,063,856 | ||
| Annual Checkings | 760,071,362 | |||
| 2023 | ||||
| Memorial Day | 27 May | 2,206,475 | ||
| July 4th | 4 Jul | 2,007,441 | ||
| Thanksgiving | 28 Nov | 2,171,943 | ||
| Christmas | 25 Dec | 2,028,266 | ||
| Highest Record | 26 Nov | 2,908,785 | ||
| Lowest Record | 31 Jan | 1,534,786 | ||
| Annual Checkings | 858,548,196 | |||
| Source: TSA Passenger Volumes Designer: Joram Mutenge www.jorammutenge.com |
||||
Get the full code here. If you want to learn how to transform data like I did in this post, check out my Polars course.